Edmonton Housing Data Analysis
About the Project
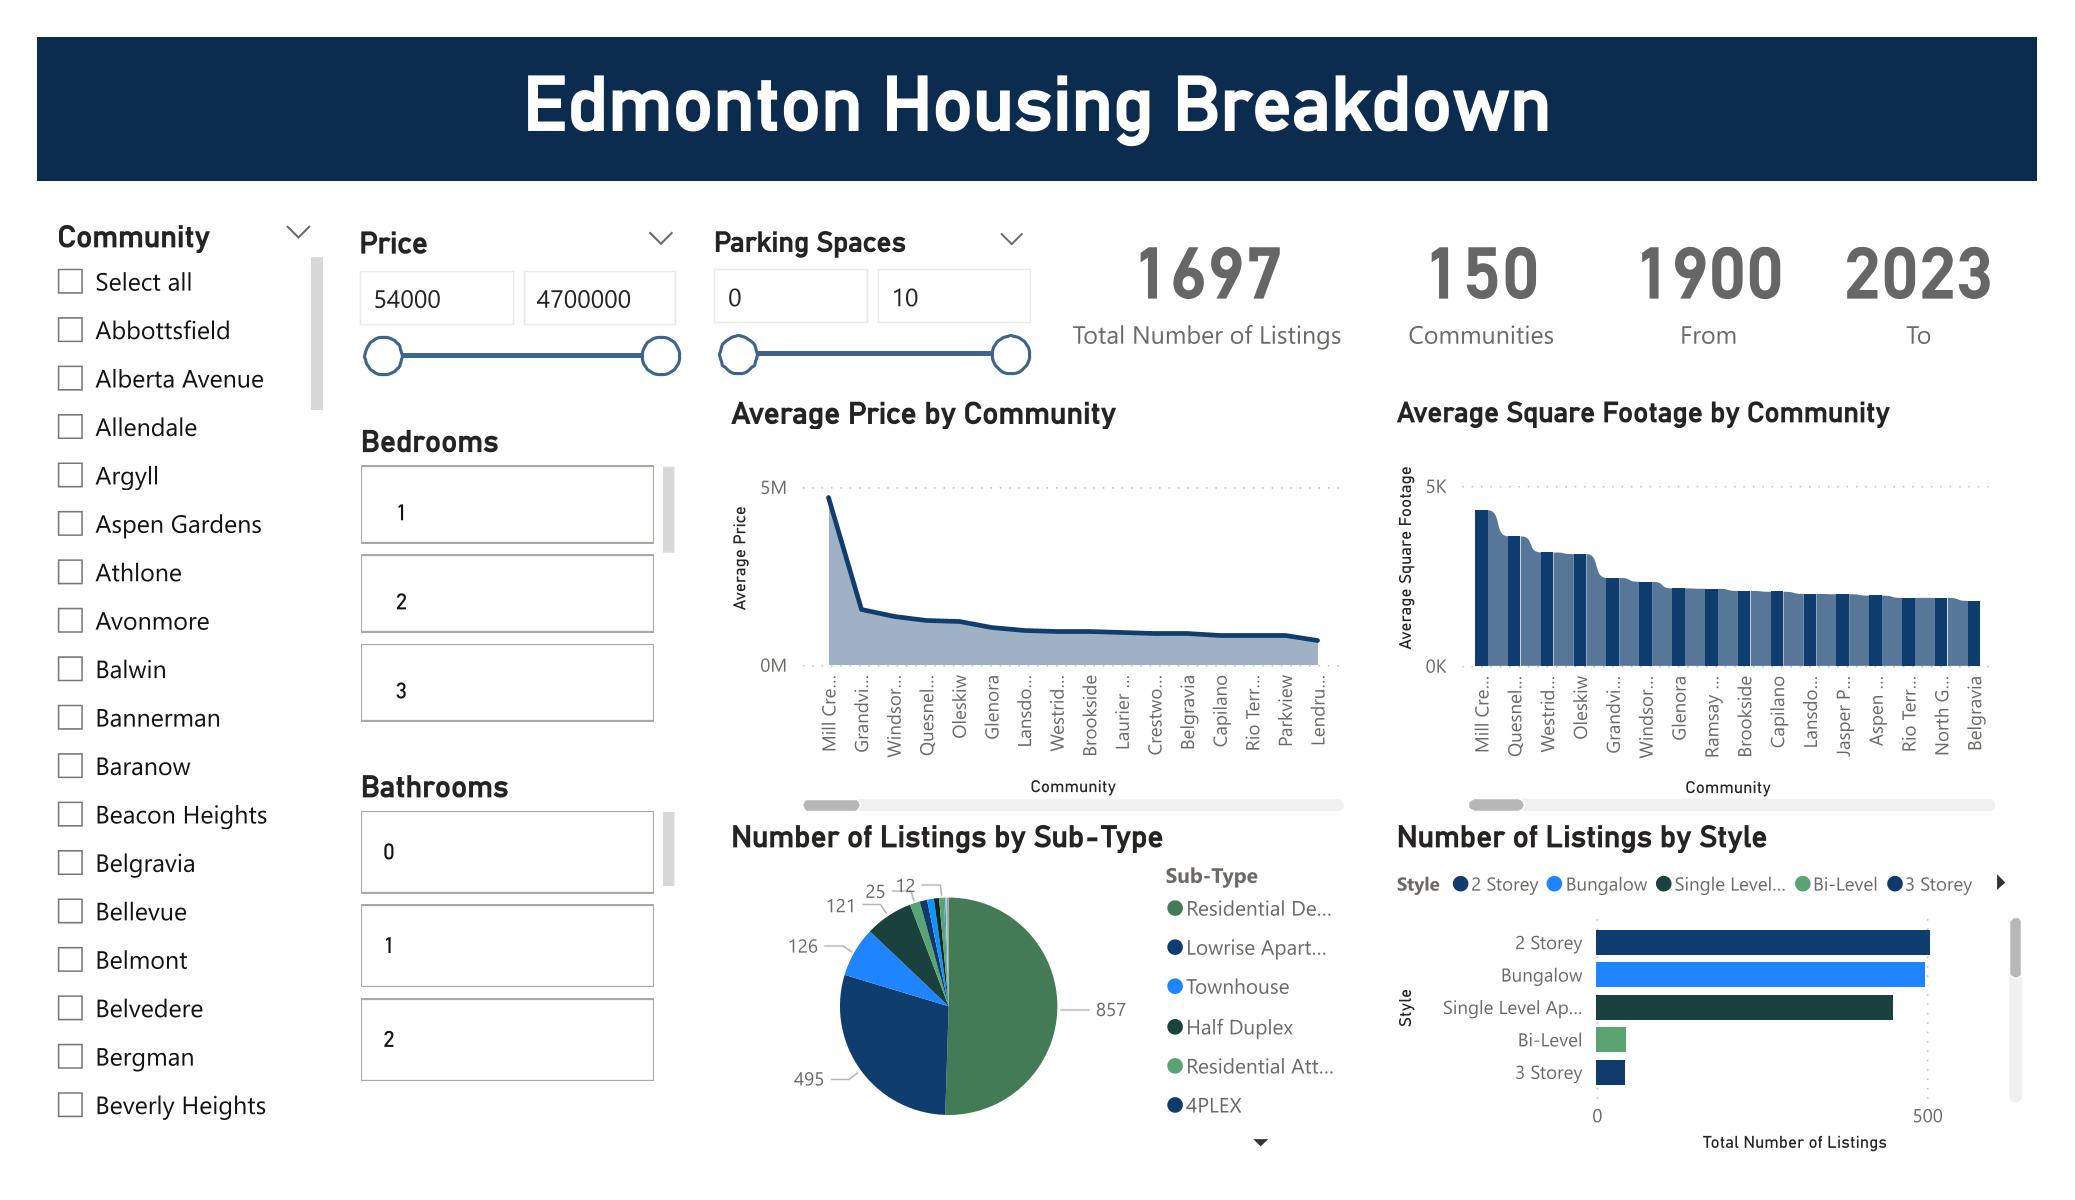
This project delves into the Edmonton housing market, employing a robust methodology to clean, analyze, and visualize housing data. It leverages SQL for data cleansing, Pandas for data analysis, and Power BI for crafting an interactive dashboard that brings forth insights into housing trends.
Explore the interactive dashboard to gain an understanding of the housing landscape, examine the average pricing, and assess the community-based housing distribution.
Project Components
Data Cleaning: Utilized SQL and Pandas to standardize and rectify the housing dataset, ensuring a high-quality foundation for analysis.
Data Analysis: Conducted comprehensive analysis using SQL queries and Pandas operations to extract key metrics and insights.
Data Visualization: Created an interactive Power BI dashboard, facilitating an engaging exploration of the housing data.
Using the Dashboard
Accessing the Dashboard: The Power BI dashboard is available for interaction, providing filters and slicers for a customized view of the data.
Exploring Data Points: Navigate through various visualizations to understand market trends, pricing, and demographic distributions.
Tools and Techniques Used
SQL: Executed data cleaning and analysis through structured queries.
Pandas:Utilized for its data manipulation strengths within a Python environment.
Power BI: Chosen for its powerful data visualization capabilities to represent data interactively.